Stop Misusing t-SNE and UMAP for Visual Analytics
1. Stop Misusing t-SNE and UMAP for Visual Analytics
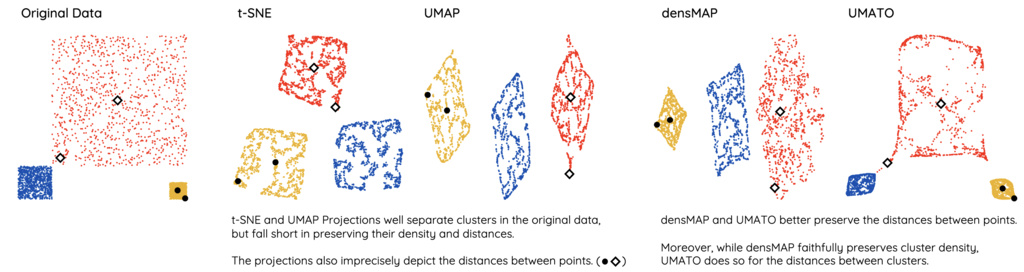
t-SNE and UMAP are effective dimensionality reduction (DR) methods. These techniques are appropriate for tasks such as neighborhood and cluster identification because they faithfully preserve the local neighborhood structure of the high-dimensional dataset. However, they are inappropriate for tasks involving the examination of similarity or dissimilarity between data points or clusters, as they do not accurately represent global structures like distances between points.
- t-SNE: It projects a given high-dimensional data into a low-dimensional space by minimizing the divergence between two distributions: one representing pairwise similarities of the points in the original space and the other in the low-dimensional space.
- UMAP: It constructs a k-nearest neighbors (kNN) graph of the data and then optimizes a low dimensional representation by minimizing the cross-entropy between the fuzzy topological representations of kNN graphs in the high and low-dimensional spaces.
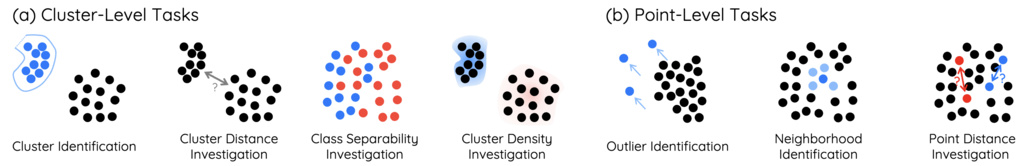
Analytic tasks using DR can be divided into four cluster-level and three point-level tasks. t-SNE and UMAP are local techniques that focus on preserving local neighborhood structures, whereas PCA and MDS are global techniques that are more effective in preserving global pairwise distances between data points.
- Local techniques are more suitable for conducting cluster identification task1, outlier identification task2, and neighborhood identification task3.
- Global techniques are more suitable for conducting cluster distance investigation task4, class separability investigation task5, cluster density investigation task6, and point distance investigation task7.
When configuring hyperparameters, practitioners should
- first understand their characteristics. For example, they should identify which hyperparameters significantly affect projection results and how. In t-SNE, for instance, “perplexity” hyperparameter controls how similarities between high-dimensional points are computed.
- Next, practitioners should learn how to optimize hyperparameters to generate projections that objectively and effectively support specific tasks. This optimization is typically done by iteratively testing different hyperparameter settings and assessing the results with DR evaluation metrics.
- To aid the testing process, search strategies such as random search and Bayesian optimization can be employed. Here, carefully selecting appropriate evaluation metrics is also important for proper hyperparameter tuning. For instance, when targeting neighborhood identification tasks, evaluation metrics that measure how well neighborhood structures are preserved (e.g., Trustworthiness & Continuity) should be used.
-
This task involves identifying clusters within DR projections, which includes counting them, labeling them, and investigating subclusters .
-
This task is about identifying outliers within projections, such as by counting them or determining if a point is a cluster member or an outlier .
-
This task aims to find data points similar to a target point based on their proximity within the projection.
-
This task uses the distance between well-separated clusters as a proxy for their similarity in the original high-dimensional space .
-
This task investigates how distinctly different classes (which are color-coded) are separated in the projections .
-
This task identifies and compares the density of clusters, using it as a proxy for the variability of data points within each cluster .
-
This task investigates the distance between data points as a proxy for their high-dimensional dissimilarity.